


Apache Pulsar, like any other business-critical component in your IT organization, requires monitoring. After all, we can’t know how well a system is running without monitoring it. Over the years, monitoring abilities have been combined — or sometimes replaced — with observability. While the goal remains to validate the state of your systems and applications, observability starts from a healthy baseline and takes a more proactive approach to maintain it. One way to integrate this into your Pulsar environment is to explore the built-in monitoring and observability features of every Pulsar deployment:
- Broker stats — these are JSON files that collect statistics for each topic. You can combine these stats with collected broker metrics on a namespace level, which details broker information and topic statistics.
- Function and connector stats — as with the broker stats, these metrics are available in JSON format.
While JSON format is sufficient for listing details, it’s not always the most convenient way to represent data or allow for its interpretation. That’s where a metrics configuration service such as Prometheus comes in. You can configure the function and connector stats to integrate with Prometheus out of the box. That said, every Pulsar deployment already comes preconfigured for Prometheus integration.
Once you decide to use Prometheus for collecting metrics, you should consider two other Pulsar statistics that don’t export metrics results into JSON. Instead, they export this data directly to Prometheus:
- Zookeeper stats — these are metrics related to the configuration store server, the clients, and Zookeeper. They are displayed using the Prometheus web interface.
- Bookkeeper stats — similar to zookeeper stats, these metrics are available from the Prometheus web interface, showing details related to the bookkeeper framework statistics.
If you’re unfamiliar with these metrics components, look at the official Apache Pulsar Monitoring docs.
Where Prometheus is powerful for generating and collecting metrics, you also want a tool for the graphical representation of the metrics results. Grafana is a great option that features tight integration with Prometheus.
Prometheus and Grafana allow integration with numerous other IT industry platforms, such as VMware, Kubernetes, NewRelic, DataDog, Azure Log Analytics, and Splunk. So, you can optimize your observability more than your Pulsar infrastructure natively allows.
This article explores how to enable observability for your Pulsar environment using Prometheus and Grafana, starting from a demo standalone Pulsar cluster. You then learn how to import sample Grafana dashboards for Pulsar from GitHub. Finally, once everything is up and running, we zoom in on several of the standard and crucial metrics for building your observability dashboards on Pulsar.
Setting up the Pulsar Standalone Cluster
There are several ways to deploy a standalone Pulsar cluster for testing. For this scenario, we rely on a Docker containerized deployment.
Assuming you have a Linux-based Docker Desktop setup available, execute the following Docker command to pull the Apache Pulsar image and run it:
docker run -it -p 6650:6650 -p 8080:8080 --mount source=pulsardata,target=/pulsar/data --mount source=pulsarconf,target=/pulsar/conf apachepulsar/pulsar:2.9.1 bin/pulsar standalone

After pulling the images and creating the necessary Docker Volumes (pulsar/data and pulsar/conf), the various Pulsar components initiate. Your output is similar to the image below:

This confirms that Apache Pulsar and all necessary components are running.
You can validate this by inspecting the Docker container for Pulsar using the following Docker command:
Docker container ls

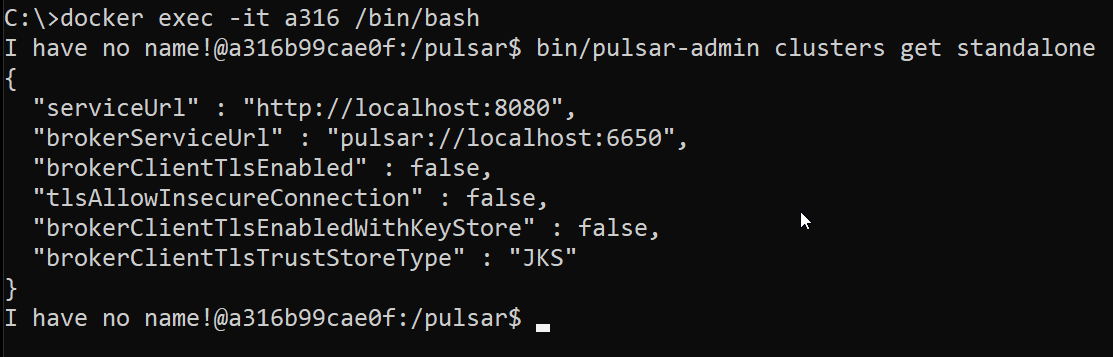
Note the container ID (a316b99cae0f in our example, but your ID is different). Run the following Docker command to connect to the SSH-terminal system prompt of the running container:
Docker exec -it <container id> /bin/bash

Validate the Pulsar cluster by running the following Pulsar-admin command:
bin/pulsar-admin clusters list
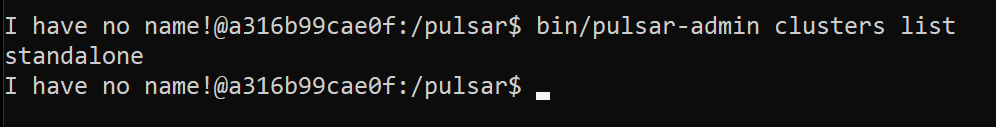
You can even look at the details of the standalone cluster:
bin/pulsar-admin clusters get standalone
Creating Sample Tenants, Namespaces, and Topics, and Generating Data
By default, the Pulsar standalone cluster comes with a public tenant and namespace. To localize our sample messaging data, let’s create a new tenant (marvelheroes) and namespace (characters):
bin/pulsar-admin tenants create --admin-roles admin --allowed-clusters standalone

Then, we must create a topic and subscription for our message routing. Execute the following command to do this:
bin/pulsar-admin topics create persistent://marvelheroes/characters/heroes-topic

Now, execute this command to create the subscription:
bin/pulsar-client consume -s "heroes-subs" -n 0 persistent://marvelheroes/characters/heroes-topic

This enables us to send a message with the command below:
bin/pulsar-client produce persistent://marvelheroes/characters/heroes-topic -k Spiderman -m "Peter Parker" -s "\n"

Now, you can see that the command is received:

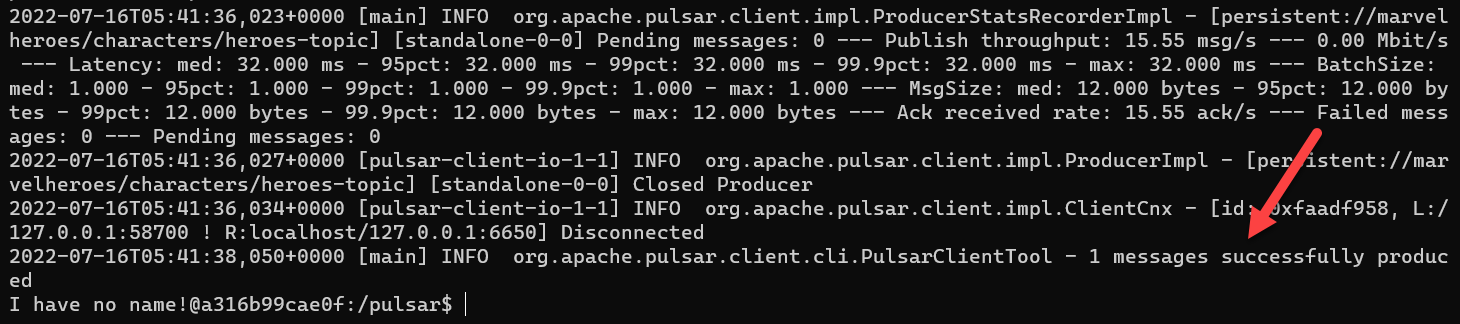
Next, generate a few more messages to validate the produce and consume process (and create some data for your Grafana dashboard). Execute the following command:
bin/pulsar-client produce persistent://marvelheroes/characters/heroes-topic -k Wong -m "Sorcerer Supreme" -s "\n"
| |
This results in the message stream shown below:

If you want to view the topic statistics, the following command provides some insights:
bin/pulsar-admin topics stats persistent://marvelheroes/characters/heroes-topic
Below are some detailed metrics from our topic, truncated to reduce image size.

You can also look at the Pulsar Admin API/Get Stats for more details on each of these metrics.
Alternatively, you can obtain a more detailed view of metrics with the following command:
bin/pulsar-admin topics stats-internal persistent://marvelheroes/characters/heroes
| |

This output shows us the number of entries (nine) processed by the topic for each Marvel Hero character.
Integrating Prometheus with Pulsar
While the Pulsar-Admin command line comes with a few options to read out metric statistics, it isn’t the observability tool we want. That’s where we must extend the environment with a Prometheus service acting as the metrics collector and Grafana as a tool for representing data in dynamic dashboards.
The easiest approach for this sample standalone Pulsar setup is to run another Docker container with the Prometheus engine already available. We recommend Prom/Prometheus from Docker Hub.
Before running the Prometheus container, you must provide the correct configuration parameters from your Pulsar environment in a Prometheus YAML configuration file. This file merely refers to the IP address of the Docker host running the Pulsar containerized workload.
While most docs refer to this as localhost, Prometheus doesn’t resolve the address https://localhost:9090/Targets. So, this example uses the developer’s host’s virtual IP address (172.26.96.1). This machine uses the Docker Bridge virtual network on a Windows machine with Ubuntu Windows Subsystem for Linux (WSL).

Your YAML file should mirror the contents below, save for updating the IP address to yours:
| |
Save this file as pulsarprom.yml (or any other name) to your local machine, as you need the file and its path later on.
Execute the following Docker Run command, which pulls the prom/prometheus image from Docker Hub and loads the YAML file into the etc/prometheus/prometheus.yml config file within the running Prometheus container:
docker run -p 9090:9090 -v <path to > /pulsarprom.yml:/etc/prometheus/prometheus.yml prom/prometheus --config.file=/etc/prometheus/prometheus.yml

From your browser, connect to https://<Docker Host IP-address>:9090, which loads the default Prometheus dashboard:

Then, from the top menu, select Status/Targets. Alternatively, directly navigate to https://<Docker Host IP-address>:9090/Targets. This page shows the different Pulsar components:

Suppose you click any of the endpoint URLs (https://IP-address/metrics). In that case, you are redirected to the Pulsar metric’s details, which technically come from the broker service:

Prometheus picks up these Pulsar metric details and pulls them into Grafana for the dashboard representation.
Note that while the sections are available, Proxy and bookie metrics are not available for the standalone deployment of Pulsar.
This completes the necessary steps to get Prometheus up and running for Pulsar.
Integrating Grafana with Pulsar and Prometheus
Let’s continue with the deployment of the Grafana tooling, again using a Docker container with the Pulsar Standalone setup.
Pull the standard Grafana Docker image from Docker Hub and run it by executing the following Docker command:
docker run -d --name=grafana -p 3000:3000 grafana/grafana

Then, connect to the Grafana dashboard from your browser: https://localhost:3000.
The default login credentials are admin and admin, but you must update the default password.

From within the Grafana homepage, select Data Sourcesto add your first data source:

Then, from the list of supported data sources, choose Prometheus:

Under HTTP, update the URLfield with the correct URL your Prometheus runtime is using (http://<Docker Host IP-address>:9090).
Scroll down and click Save and Test. You should receive a notification confirming connectivity to the Prometheus runtime.

Return to the Grafana homepage and select Dashboards.

From the New dashboard view, select Add a new panel.

Notice that Prometheus is the Data Source. However, there is a list of all available Pulsar metrics under Metrics > Select Metric.

While it’s possible to add each metric you’re looking for into a single dashboard, Datastax has shouldered much of that work. Our source is available as a GitHub repository.

To use these, navigate to the Grafana homepage, select Dashboards from the left-side menu, and click Import.

There are two ways to manage the import:
The first is to upload a JSON file from your local machine. Consider running:
git clone pulsar-helm-chart/helm-chart-sources/pulsar/grafana-dashboards
at
master · datastax/pulsar-helm-chart (github.com)
This copies all sample JSON files to your local machine.
The second option is to select an individual JSON file “as raw” from the Datastax GitHub repository, then copy the contents into the JSON field in the Grafana portal.
This is what it looks like to import the contents of the sample JSON file from the Datastax library, overview.json:

Click Load, which brings you to the summary page. Here, confirm by clicking the Import button.

The resulting dashboard looks like this:

The critical metrics listed in this dashboard are as follows:
- CPU and memory of the nodes — these require mapping with the Node Exporter, disabled by default, for the standalone setup. As with any other system, having a clear view of resource consumption could indicate the system’s health, helping you build a baseline for observability and use it as a trigger to alert you when resource consumption deviates from the baseline.
- Status of the zookeeper, broker, and proxies in your setup — the broker stats provide insight into the overall broker service information and a view of the topics organized by namespace. By default, these are refreshed out of Pulsar every minute.
- Top 10 topics backlog — If the number of messages in the backlog grows, this typically indicates a resource or availability issue with your Pulsar cluster. It may also help you identify which topics handle more message traffic, which might necessitate moving them to a larger or dedicated cluster.
Scrolling down exposes more details, including the sample topic we used for the Marvel heroes:

Key information to understand from this dashboard is listed below:
- Total producer and consumer counts — observability of both producers and consumers enable your DevOps team to create a baseline for the use and performance of the Pulsar cluster. If these numbers keep growing, you might consider expanding the cluster with more nodes to guarantee performance.
- Number of messages processed in a given timeframe — in addition to viewing the message loads, you can also see peak moments, slower moments, or moments of non-usage. This can help your DevOps team decide on overall cluster load, trend analysis, and scalability.
- Top 10 topics and their storage consumption — the topics compose the engine of message handling; the more significant these numbers, the more messages your cluster is processing. Observing the behavior on an hourly or daily basis helps you identify the average consumption, performance, and availability of your Pulsar infrastructure.
Now, save the dashboard.
Repeat the same process of importing a JSON file, this time selecting topic.json as the source. The resulting dashboard shows more detailed metrics related to the Pulsar topics:

As a final example, import the messaging.JSON dashboard file from the Datastax GitHub repository. The resulting dashboard should look similar to this:

The critical information to observe includes:
- The number of topics — similar to the previous dashboard, you have a clear view of the behavior of your topics, the number of messages they process, and the overall load. This information keeps your DevOps teams in the know to guarantee the stability of the Pulsar infrastructure.
- List of subscriptions, producers, and consumers — although the core impact of Pulsar’s performance comes from the number of messages it handles, growth in the core components might also indicate an overloaded or undersized infrastructure.
- Msg (message) backlog — this represents the total backlog size of messages linked to the given namespace and topic. While having a backlog doesn’t immediately indicate a significant issue, it’s an accurate performance indicator for the overall Pulsar environment’s health and average load, especially when defining a trend analysis.
Summary
Observability is crucial for DevOps teams to identify the state of Pulsar services and establish an infrastructure’s baseline. Fortunately, you can easily enable this observability in your Pulsar standalone cluster by integrating Prometheus and Grafana Docker.
To address the complexity of monitoring the metrics that come with Pulsar observability. DataStax provides an open-source GitHub repository with ready-to-import Grafana dashboards in JSON format. Your DevOps team can quickly access all the metrics needed to analyze and make informed decisions about your infrastructure.


